In the previous article we managed to setup a SonarQube server, configured .NET projects and ran the analysis. Now it’s time to look at the results. This will help us get familiar with SonarQube visualizations and capabilities.
Note! Code taken for analysis is a snapshot of Jon’s Skeet’s repository. At the time of reading this it may got changed. It doesn’t diminish the benefits though as SonarQube features are stable over time. So is code by Jon Skeet.
Note! All analysis results are available for public access here under my SonarCloud account. It’s a great opportunity to play around with SonarQube with real data.
Busted…?!
Not at all. Almost all projects are shining green announcing they’re in a good shape. Well, personally, I’m not surprised. So, what’s the purpose of this article? Let’s examine Jon’s style of coding, .NET project governance, habits etc. What’s more - we will learn SonarQube along the way. Ready?
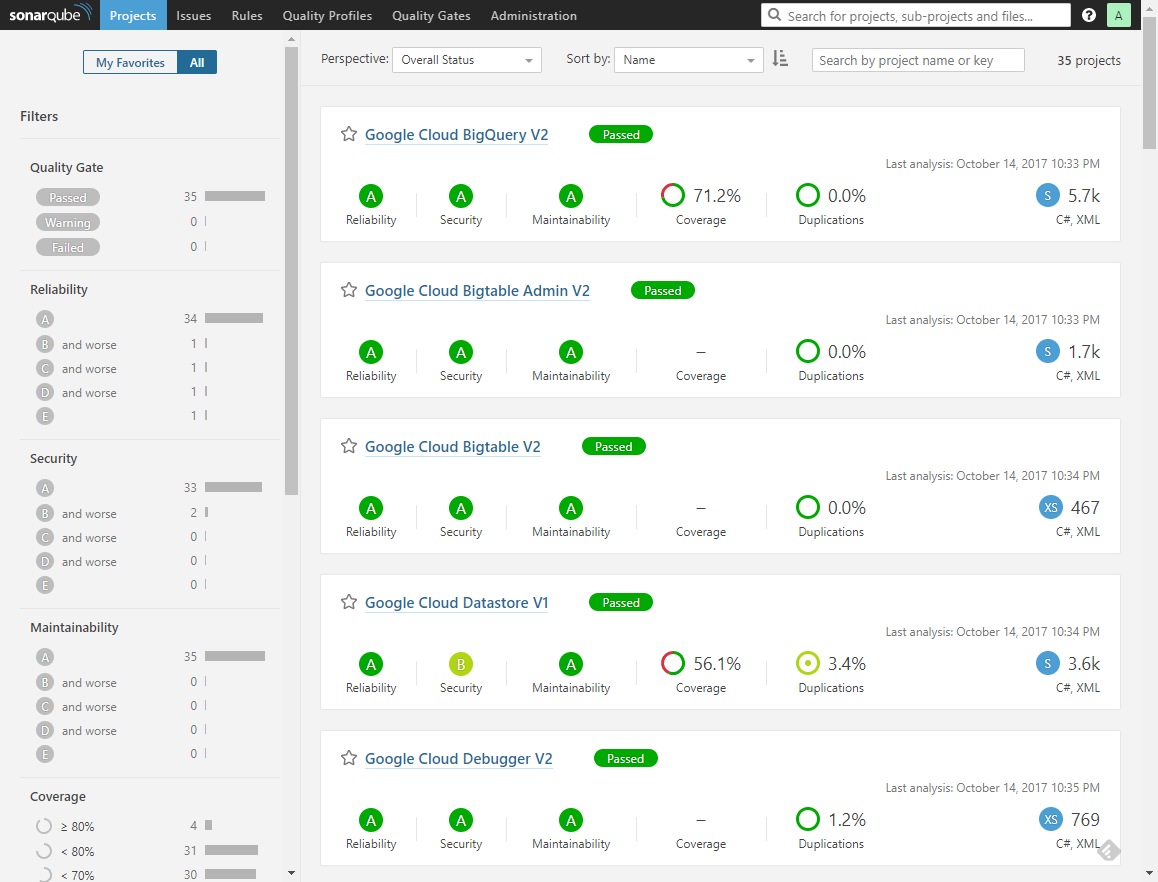 Projects overview in SonarQube.
Project characteristics
35 Visual Studio solutions were analyzed (1 VS solution = 1 SonarQube project) and classified by Sonar as rather small size (XS or S, that is up to a few thousands LOC). Interestingly, some of them didn’t even contain unit tests.
Filtering
On the left there is an intuitive filtering panel with filter options related to various code metrics. We can add projects to our favorites and filter them to focus on our main interests during everyday work. We can also use tags that help us group projects. And last but not least, located at the top, a sorting field which is perfect means for setting up competition between teams within our organization.
Perspectives
Risk
Various perspectives facilitate projects comparison and some more cross-project analysis. First one is Risk which visualizes the potential for risk materialization in your project portfolio. You can quickly assess where the outliers are and remedy problems early in their lifecycle.
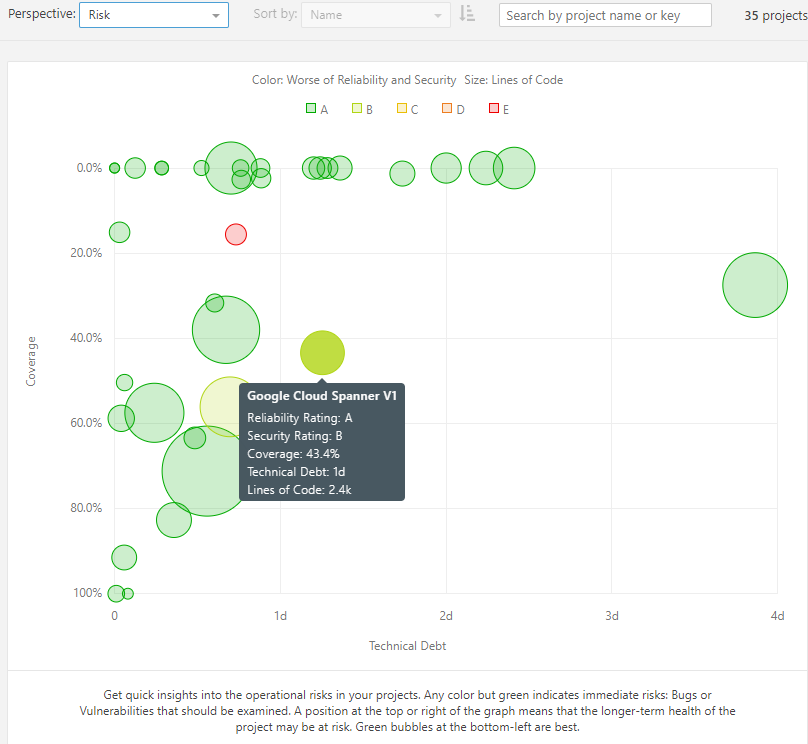 Risk across projects.
A quick look at the projects performance unravels that only Google Cloud PubSub V1 may suffer from technical debt accretion in the long run. Revisiting the visualization on a regular basis could help you detect when projects start to behave odd and plan for eventual technical debt reduction.
Maintainability and Technical debt
Maintainability perspective renders technical debt distribution across projects by their size. The main point is to detect project-renegades (outliers), which don’t fit into a common trend line.
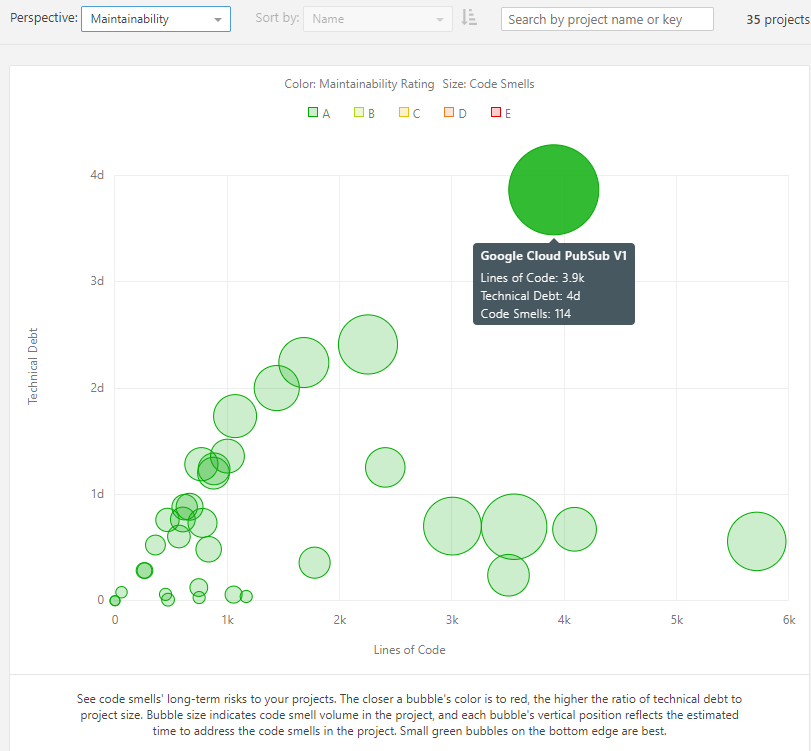 Maintainability of projects.
What trend line do I mean? First, the ideal constellation is a straight horizontal line of green bubbles at the very bottom. Second, existence of a linear trend most likely stands for ignoring (or not being aware of) some subset of quality rules by which Sonar reports issues (and calculates technical debt). Such straight line is present in Jon’s projects analysis. Well, he didn’t agree on any SonarQube quality rules when he developed his libraries, so this fact should not be surprising. Next, what about growing complexity? The more logarithmic (or constant!) the trend, the better. The exponential dependency would suggest that we misconfigured Sonar or there is a weak process of software development and programming practices indeed.
Last but not least, project renegades. If any project deviates substantially from the rest, it’s worth taking a closer look at it. Does it cause significantly more errors during test phase (or in production)? Or does it take longer to deliver new features etc? If the answer is yes (and most often bad maintainability impacts business value delivery), we may consider some practices sharing within our organization. In case the renegade group constitutes a major trend, we could benefit from staff training to repair software development practices.
Code coverage vs Complexity
Solid code coverage is especially beneficial in large, complex projects. Why? It reassures newly added/changed lines don’t introduce regression bugs. Automatically. This grows your confidence in rapid development techniques. So, what does the landscape present here? The top right corner which is particularly dangerous pasture for you herd. In there you can really get hurt as you have complex solutions with no cheap means to safeguard new code changes. In dynamic environments and tight deadlines this is a common place to end up the life of a project. Nobody wants to be there.
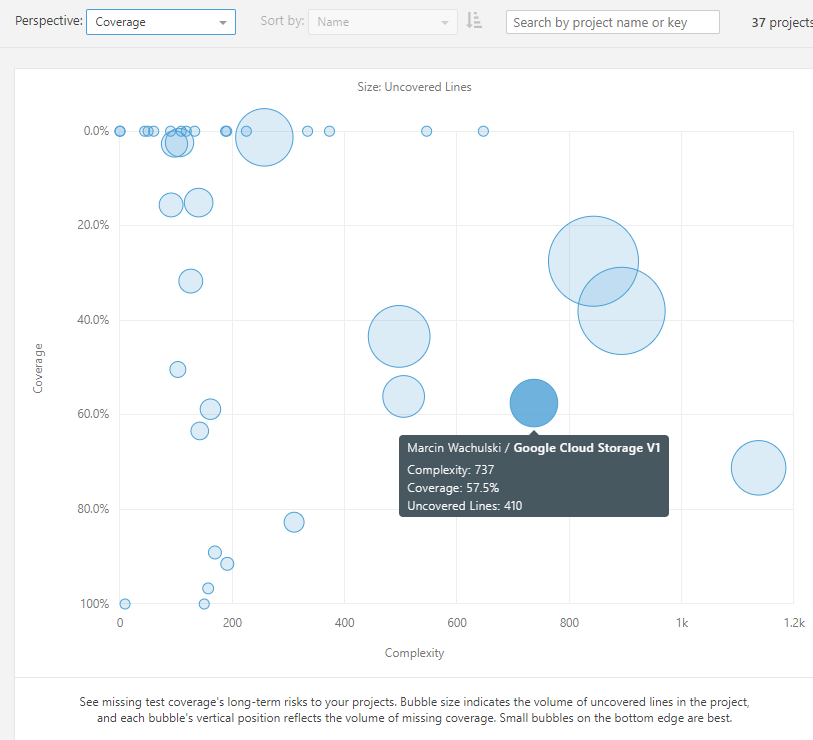 Code coverage and complexity across projects.
How do Jon’s projects perform here? Quite well. Lots of small projects well covered or with no tests at all. I conclude that time efficiency and tradeoffs dictated not to introduce unit tests. Probably those libraries would benefit more from integration tests which were out of the scope of this analysis. In general, nothing prevents you from including them. There are however several bigger bubbles driving towards the top right corner that may require some treatment.
This was the last perspective described here. I presented only a subset of options available. At the time of writing the full selection also includes: reliability, security and duplications. All results are available here, so you may play around yourself. Good time exploring!
In the next article we focus on detailed analysis of a single project. We define rules, profiles, gates, project lifecycle, administration and more…