Last time I presented analysis results of Jon Skeet’s Google Cloud Services .NET projects. We learnt how SonarQube supports cross project analysis and drawing conclusions. In this article I’m going to step into details of a single project, dashboards, configuration options etc.
Note! Code taken for analysis is a snapshot of Jon’s Skeet’s repository. At the time of reading this it may got changed. It doesn’t diminish the benefits though as SonarQube features are stable over time. So is code by Jon Skeet.
Note! All analysis results are available for public access here under my SonarCloud account. It’s a great opportunity to play around with SonarQube with real data.
Microcosmos of code
Let’s take a look at the a single project overview provided by Sonar:
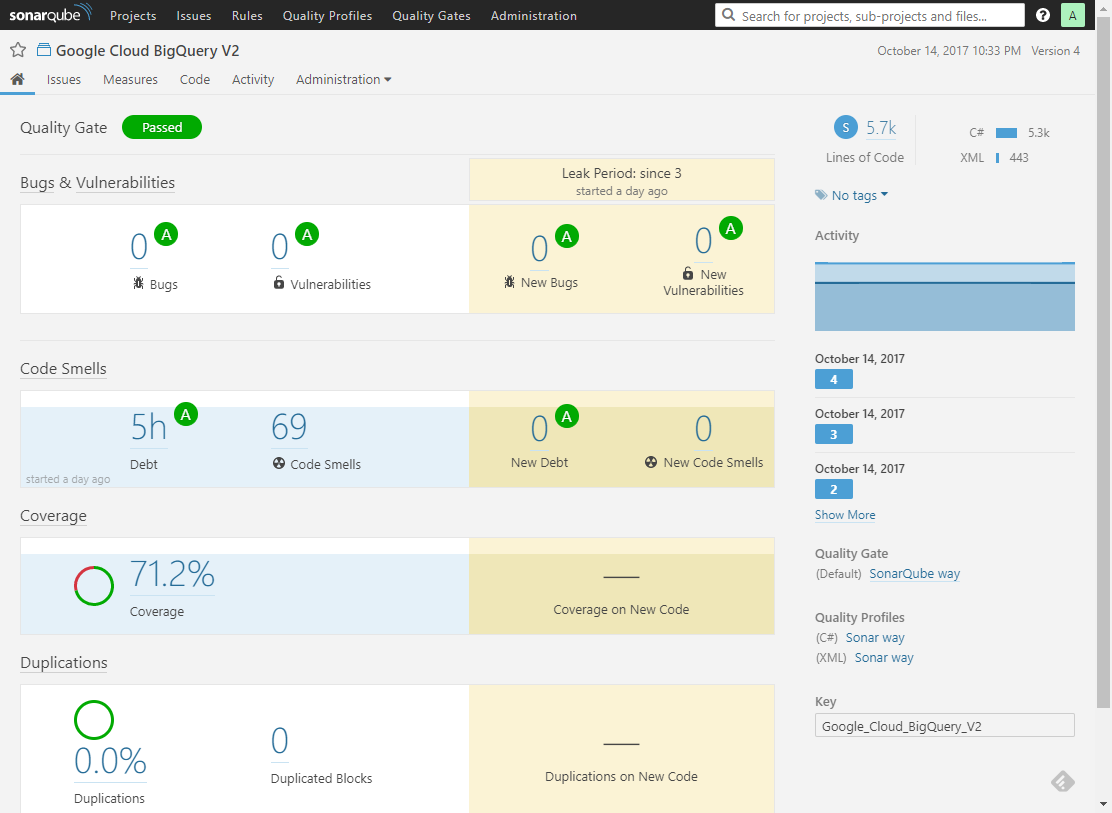 Project overview. Just a quick glance for a health check of code.
Some numbers, colors around, maybe also some cryptic titles. I’m going to describe each section in details.
Its very top contains quality status information: either acceptable (green) or unacceptable (red). This has the following meaning: under what was agreed as good-enough (acceptable) code and configured with SonarQube the codebase has either all those properties or not. This is vital in CI/CD scenarios when it may immediately block the pipeline execution.
Little below, there are four sections, namely:
- Bugs and Vulnerabilities: how many issues of high importance detected.
- Code smells: how many issues that harm code readability and maintenance detected.
- Coverage: % of code taken into account by executed tests.
- Duplications: how much code has nearly same representation in various places of the codebase.
Each of them sums up the fundamental measures belonging to the specific area. You may wonder what that colorful A-F classification represents here. These basic score labels help you quickly assess the health status across various project dimensions and compare multiple projects with each other.
Each section is divided into two columns. The left one stands for overall status for the whole project codebase. The right column is filled with analogous information, but considering only the leak period, meaning only new/changed code from the last analysis was taken into consideration. So, doing the analysis regularly, one can clearly determine who and when improved or degraded code quality. Also, a CI/CD pipeline can act upon code changes and e.g. block unacceptable increment. Imagine you work on a a project with high technical debt (sadly, that doesn’t require sophisticated imagination as most of us do) and only recently company started a remediation effort. Then, focusing on leak periods is vital for blocking new bad code while struggling towards decreasing technical debt on the whole.
If two or more analyses were performed for a given project, it would contain sections with charts rendered in their background. This is a sort of timeline for a given characteristic of the project. Sections present only the most important measures. More details, drill downs, advanced visualizations specific to areas etc. are available in corresponding tabs on the top just below the project name. A selection of them is presented later in this article.
Now, the panel to the right. Starting from the top:
- Project size in LOC (lines of code), categorized by programming languages.
- Area chart presenting Lines to Cover (upper) and Covered Lines (lower).
- Activity: analysis events (labelled).
- Project configuration in terms of which quality rules are applied in analysis.
- Project unique key (acting as an ID for SonarQube). It is essential to use a correct identifier for an analysis, otherwise a new project will be created.
May I enter, sir? Rules, profiles, gates
Rules
Every issue reported by Sonar has its rule counterpart. In fact, every analysis loads a ruleset from the server and then files containing code are examined for rules violations. If found, an issue is reported. Consequently, various metrics (e.g. reliability, security, maintainability) are built upon the issues outcome. You may also think about it as linter or hinter rules that are used to produce warnings in your IDE every time you’ve written suspiciously looking code.
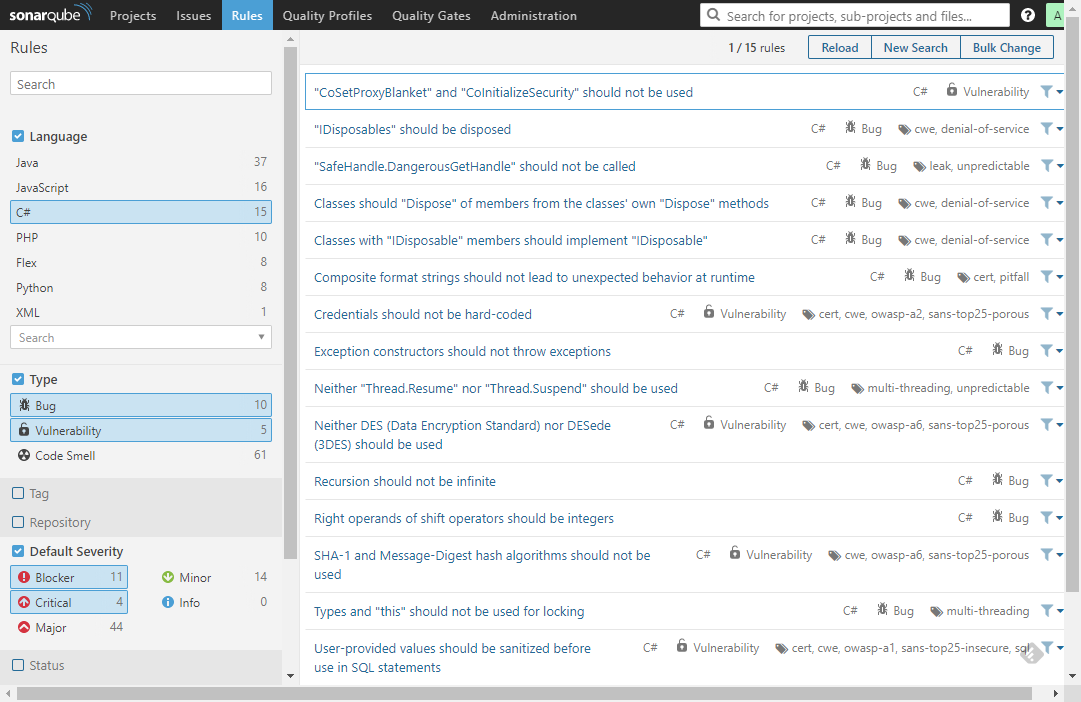 Rules repository - wisdom of language experts that fuels analysis automation.
The picture above presents 15 most severe C# rules. To the left - as usual, search and filtering options. If you click one, its details will show up. In there:
| Title | Description |
|---|---|
| Type | a bug, vulnerability (security issue) or code smell (tech debt issue) |
| Severity | how big impact it has for the codebase |
| Tags | labelling which enables quick and intuitive rules exploration |
| Date | when the rule was first introduced |
| Language | programming language classification |
| Remediation function | cost of repairing a single violation |
| Description | detailed explanation of the rationale and implications |
| Non-compliant code | example code that violates the rule |
| Compliant code | example code that conforms to the fule |
| References | points you to external materials, industry standards etc. |
| Profiles | list of profiles that activated the rule |
| Issues in projects | total number of issues found across the analyzed projects |
Profiles
Each rule can be assigned a profile. Check out Quality Profiles tab where you can quickly recognize that they’re just a named bags for rules in particular programming languages.
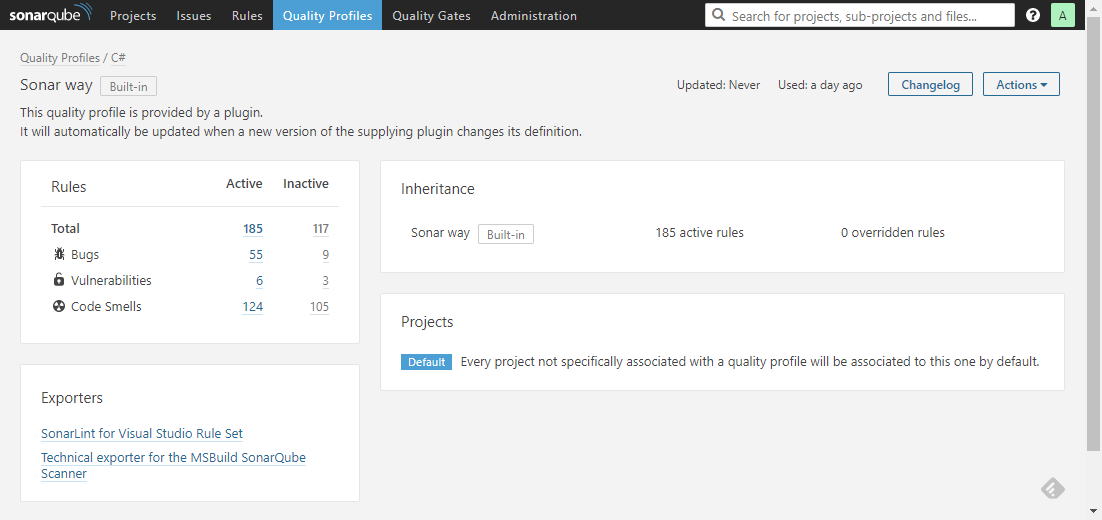 Quality profiles - named bags for rules, assignable to projects.
Let’s skim through an example. In a given profile you can activate as many rules from the rules repository as you want. But how to effectively select them? You need to establish some decent consensus among all its potential users. Why? For them to cherish living with SonarQube on a daily basis ever after. Otherwise fixing noisy issues would make more harm than good. A common practice is to give people a chance to build profiles together. Another one - start with a strict rule set and gradually exclude ones that are more limiting than beneficial. This is easy when the scope is one team. What about the whole organization? Having a common policy is good, but the downside is that everyone needs to comply. SonarQube leaves the final choice to you.
Gates
Quality gates are there to make final decisions - whether to accept or reject the whole analysis. They consist of criteria that are examined against the metrics of the code being analyzed. Its binary output enables a properly configured CI pipeline to continue or stop. The effect is that the whole team or organization can sleep well and assume code entering the main branch of development meets the quality bars. The offender usually repairs defects and saves human reviewers time.
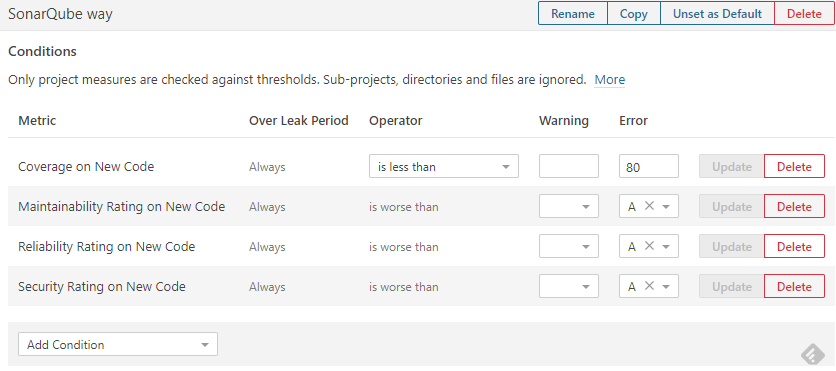 Quality gates - guard your repository from low quality entries.
Reliable code
In SonarQube the basic metric of code quality is: correctness. Does it mean Sonar can do mathematical proofs for you? No, correctness here is meant for indication that no clear evidence (symptoms, code patterns etc.) of invalid constructs is found.
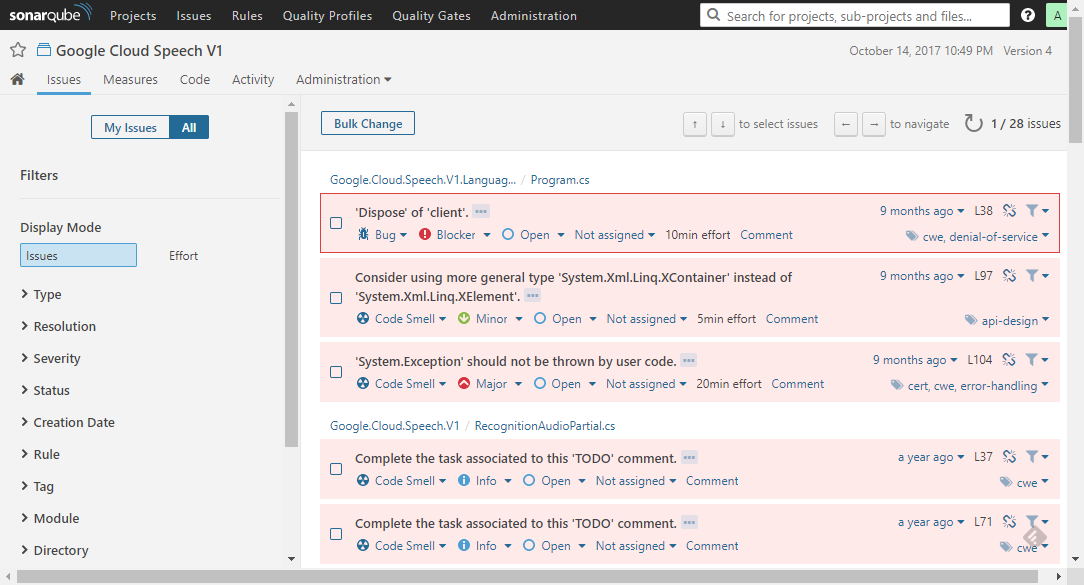 Project issues board.
Under the Issues tab in the detailed view of a project you can search for issues reported. Each can be assigned a person to work out a resolution (a fix, won’t fix, false positive etc.). Even automatically as git blame makes perfect work in this forensic science. My Issues filter is recommended as a daily habit. Now, let’s see an example of a serious violation - a blocking error:
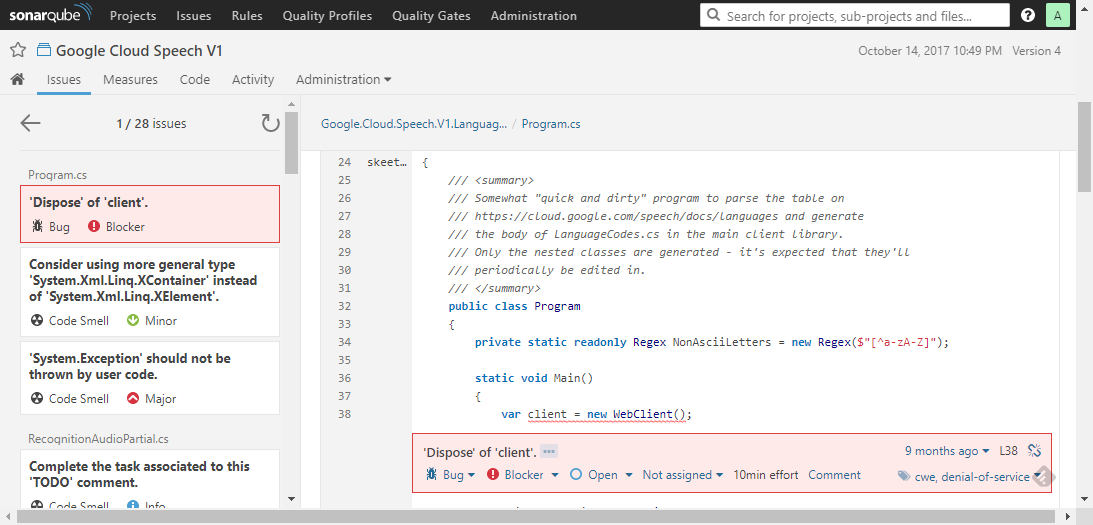 An example of a blocker issue - the author envisioned that and documented well.
The navigation pane - on the left, and in the main area - the source file containing issues rendered in red boxes just below the violating line. You can quickly:
- read issue details (
...icon) - classify the issue changing its type
- modify the severity
- set its handling status
- assign a person
- comment and get involved in a discussion how to resolve the issue best
As you can see, Sonar gives you room to manually override issue properties if automatic classification isn’t accurate enough.
And when it comes to Jon Skeet’s code – well, he cautioned potential readers (Program.cs, line 26) that he favoured time over quality in that case. A deliberate decision, well documented - a good example how to proceed with tradeoffs.
Security in the era of rush
Similarly to code issues related to the correctness, Sonar reserves a dedicated category for security flaws. This is especially helpful as no profound security knowledge is required from an average developer nowadays. In consequence, it’s quite easy to commit a vulnerability which may have disastrous results for the whole company. Every little aid is vital here. So, interested what Sonar does for security analysis? There is a bunch of rules written to cover industry standards such as MITRE, CWE, CERT, OWASP, SANS, for example:
| ID | Title |
|---|---|
| S2278 | Neither DES nor 3DES should be used |
| S2070 | MD-* i SHA-1 should not be used |
| S3649 | Values provided by the user should be verified before implementing SQL |
| S2386 | Mutable fields should not be both public and static at the same time |
Technical debt and its economy
The definition of technical debt is out of scope of this article. Nevertheless, it’s vital to understand it well, as it’s the cornerstone of talking about code quality management in software engineering. Martin Fowler provides a brief and luminous introduction. So, Sonar gives you Maintainability measure which sums up project technical debt. In fact it’s yet again about a set of rules. This time they are classified as so-called code smells detectors. And here we have two main dimensions. First - total time needed to repair the code that slows development down each cycle. Second - technical debt as % of your entire codebase. This is particularly useful for projects comparison. Here comes a selection of interesting rules:
| ID | Title |
|---|---|
| S3216 | ConfigureAwait(false) should be used on Task |
| S1163 | Exceptions should not be dropped from finally block |
| S2696 | Components of the objects’ instance should not write to static components |
Now, something I like Sonar much for: cognitive complexity. What is it? A special rule that detects complex blocks of code. Though, its complexity definition differs from what most of us know as McCabe’s cyclomatic complexity. One picture and I’m pretty sure you understand (and fall in with it):
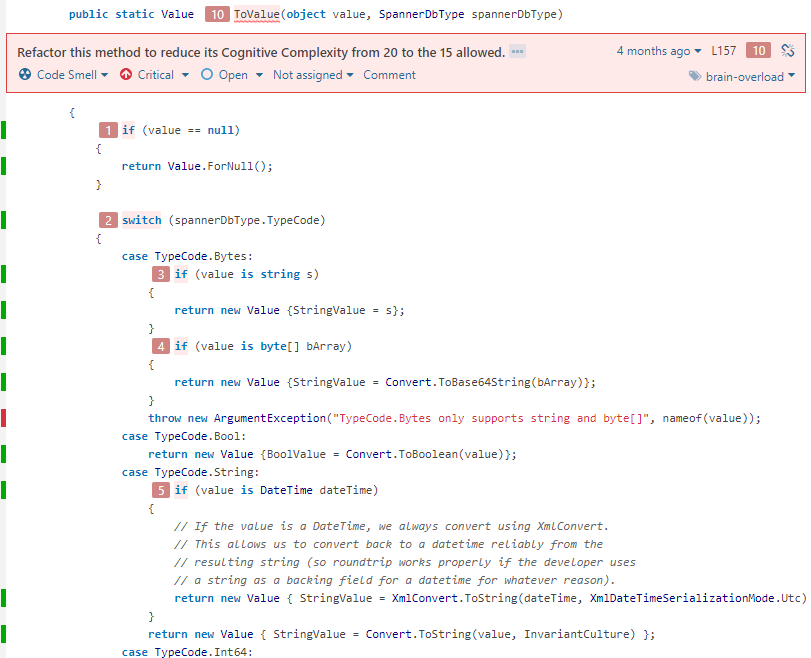 Overly complex code with its step-by-step breakdown.
Here comes a nice trick: allowed complexity level is configurable. Imagine forests of conditionals like ifs, switches turn into well named methods or (after some training most likely) proper object-oriented code.
Code coverage – mythical 100%
A lot has been said about importance of unit testing, TDD, 100% code coverage. While there’re numerous heated debates on the Internet, I’m not going to ask you dear reader to get familiar with my opinion. Instead of heating it all up, I present you with a Sonar heatmap example:
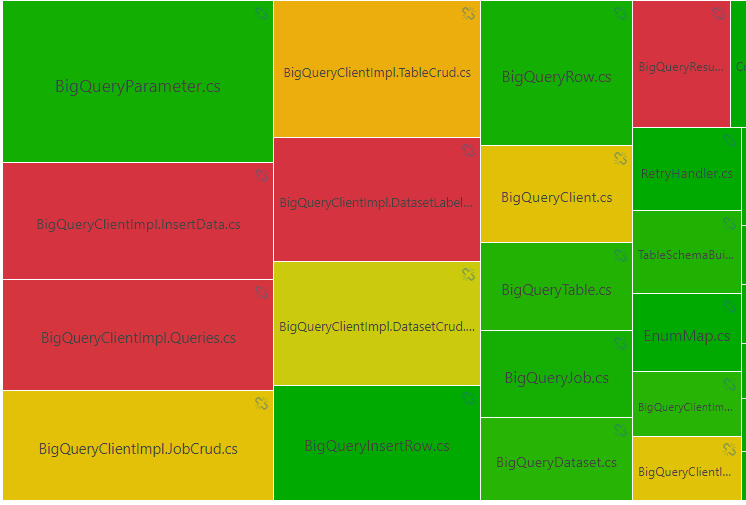 Coverage heat map indicates areas that are ruled by No-Tests gangs.
The more red, the bigger the cry for test coverage. Decision as always - up to you.
Summary
Huh, lots of Sonar capabilities covered. A project overview with most valuable metrics, issues found in each analysis, rules repository, technical debt and code coverage. For most of them we’ve just looked at the surface. I encourage you to play around in a free SonarCloud workspace with the analysis I did for the purpose of this article. You can find it here in my SonarCloud space.
More on SonarQube to come, stay tuned.